Using Anchored VWAP and SwingVWAP Programmatically in NinjaScript
One of the advantages of the CodeNTrade Anchored VWAP is that the indicators can be accessed directly from NinjaScript. This allows you to incorporate Anchored VWAP logic into your own custom strategies and automated trading systems.
This post walks through the basics of using both the Anchored VWAP Indicator and SwingVWAP programmatically.
Why Use the Anchored VWAP Indicator Instead of the Drawing Tool?
NinjaTrader drawing tools generally are not designed to be accessed programmatically from NinjaScript. This makes it difficult (or impossible) to reliably fetch values from an Anchored VWAP drawing object.
That is exactly why the CodeNTrade Anchored VWAP Indicator exists.
The indicator version exposes the VWAP data directly through NinjaScript, making it easy to integrate into your own code.
Anchoring an Anchored VWAP to a Specific Bar
You can create an Anchored VWAP by anchoring it to a specific bar index.
// anchoring to a specific bar by id (2nd parameter)
var vwap = AnchoredVWAPIndicator(
null,
CurrentBar,
CodeNTradeAnchoredVWAPPrice.Typical,
0
);
// get the value of the VWAP for the current bar
var currentVwapValue = vwap.Values[0][0];
Parameters
First parameter: Date/time anchor (null when using a bar anchor)
Second parameter: Bar index to anchor to
Third parameter: Price type
Fourth parameter: Standard deviation bands to plot
Anchoring an Anchored VWAP to a DateTime
You can also anchor the VWAP to a specific date and time instead of a bar number.
// anchoring to a specific datetime
var vwap = AnchoredVWAPIndicator(
"2023-03-20 00:00",
null,
CodeNTradeAnchoredVWAPPrice.Typical,
0
);
// get the value of the VWAP for the current bar
var currentVwapValue = vwap.Values[0][0];
This approach is useful when anchoring to:
Economic events
Session opens
Gap fills
Earnings releases
Important market turning points
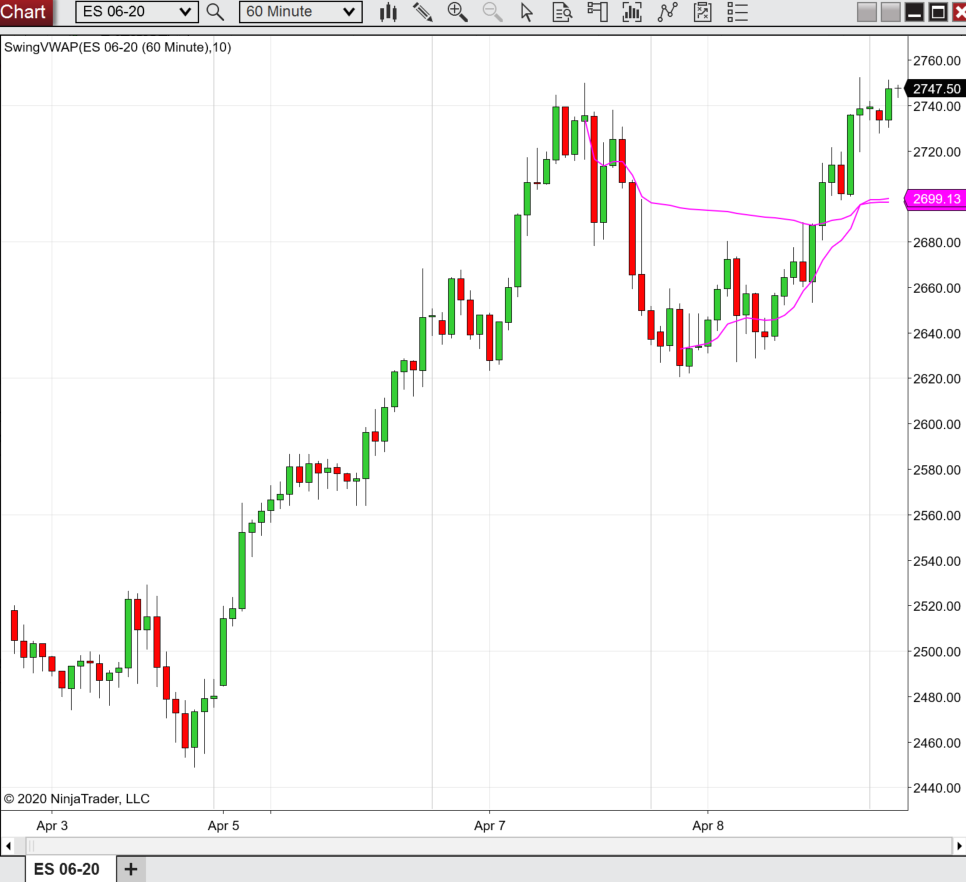
Using SwingVWAP Programmatically
SwingVWAP can also be accessed through NinjaScript.
// create a swing VWAP
// first parameter = swing strength
// second parameter = number of VWAPs
// third parameter = number of standard deviations to plot
var swingVwap = SwingVWAP(10, 1, 0);
// fetch the underlying anchored VWAP indicators
var vwaps = swingVwap.GetVwaps();
// fetch the current value from one of the VWAPs
var currentVwapValue = vwaps[0].Values[0][0];
Important Consideration When Using SwingVWAP
SwingVWAP dynamically updates as new swings form in the market.
This means:
Old VWAPs may be removed
New VWAPs may be added
The VWAP array returned by GetVwaps() can change over time
If your strategy stores references to specific VWAPs or depends on array ordering remaining constant, this behavior can produce unexpected results.
It is important to design your logic with this dynamic behavior in mind.
Common Use Cases
Some common ways traders use these indicators programmatically include:
Automated support/resistance detection
Mean reversion strategies
Trend confirmation systems
VWAP crossover signals
Multi-timeframe analysis
Alert generation
Dynamic trade management
Institutional accumulation/distribution analysis
Final Thoughts
The ability to access Anchored VWAPs directly from NinjaScript opens up a wide range of possibilities for custom strategy development inside NinjaTrader.
By exposing the VWAP values programmatically, the CodeNTrade Anchored VWAP products make it possible to build sophisticated trading systems that would not be practical using drawing tools alone.
If you have additional questions about using the indicators programmatically, feel free to reach out through the contact page.
As of version 2.0.0.0, all Code-N-Trade products have transitioned to NinjaTrader’s new user-based licensing system.
This update simplifies licensing and removes several common pain points.
What’s Changing?
With user-based licensing:
No more Machine ID submissions when you upgrade or change computers
Use your license on up to two machines simultaneously
Licensing is tied directly to your NinjaTrader account email
This means a much smoother experience when replacing hardware, reinstalling Windows, or switching between desktop and laptop.
Important: This Is a Beta Release
Version 2.0.0.0 is currently being released as a beta while we complete license migrations and validate everything in live environments.
If you are an existing customer, please contact us so we can migrate your license to the new system.
When reaching out, include:
Your NinjaTrader account email address
The product(s) you own
This ensures we associate your license correctly under the new framework.
Installation Instructions
Before installing version 2.0.0.0:
Uninstall any prior versions of the CodeNTrade bundle from NinjaTrader.
Install the new 2.0.0.0 version.
Contact us with your NinjaTrader email so we can complete your license migration.
If you encounter any issues during activation or installation, please reach out immediately so we can resolve them quickly.
We’re confident this change will make licensing significantly easier and more flexible moving forward, and we appreciate your support during this beta transition.
Calendar VWAP automatically plotting WTD, MTD, YTD VWAPs and more.
As a trader, you are always looking for ways to improve your analysis and increase your profits. One of the most important tools in your trading arsenal is the VWAP (Volume Weighted Average Price) indicator. However, manually plotting VWAP indicators for various time frames can be time-consuming and cumbersome. This is where Calendar VWAP comes in, a powerful new product that automatically plots dated based VWAPs on your chart.
What is VWAP?
Before diving into the benefits of Calendar VWAP, it’s important to understand what VWAP is and why it’s so crucial for traders. VWAP is a technical analysis tool that calculates the average price of a security over a given time period, weighted by the volume traded at each price level. VWAP is used by traders to identify the average price at which a stock or other security was traded during a specific period, and to analyze the strength of the market trend.
The Benefits of Calendar VWAP
Calendar VWAP is a new product that automates the process of plotting VWAP indicators for various time frames. With Calendar VWAP, you can quickly and easily plot week-to-date, month-to-date, year-to-date, 365 day, 270 day, 180 day, 90 day, 60 day, 30 day, 5 day, 3 day, 2 day and one day anchored VWAP indicators on a chart. This saves you time and allows you to focus on analyzing the market rather than manually plotting indicators.
Flexibility of date-based VWAPs
One of the key benefits of Calendar VWAP is its flexibility. You can customize the time frames of the VWAP indicators based on your trading strategy and preferences. For example, if you are a swing trader, you may be interested in plotting the 60-day and 90-day anchored VWAP indicators to identify longer-term trends. On the other hand, if you are a day trader, you may prefer to use the 5-day and 3-day anchored VWAP indicators to analyze short-term market movements.
Time savings with Calendar VWAP
Another key benefit of Calendar VWAP is time savings. The product updates your VWAPs automatically over time, ensuring that your time-based Anchored VWAPs are always plotted from the right point. This is especially important for traders who rely on VWAP to make trading decisions.
Calendar VWAP Configuration
In addition, Calendar VWAP is easy to use and requires no technical knowledge. The product is designed to be user-friendly and intuitive, with a simple configuration that allows you to quickly and easily plot the VWAP indicators on a chart. This means that you can start using the product right away, without the need for extensive training or support.
Get started with Calendar VWAP
Finally, Calendar VWAP is a cost-effective solution for traders. The product is priced competitively, making it accessible to traders of all levels. In addition, the time saved by using the product can be used to focus on other aspects of your trading strategy, potentially increasing your profits over time.
In summary, Calendar VWAP is a powerful tool that offers a range of benefits to traders. The product saves time, increases accuracy, is flexible and customizable, is easy to use, and is cost-effective. By automating the process of plotting VWAP indicators, Calendar VWAP allows you to focus on analyzing the market and making informed trading decisions.
As with all of our tools, you can get started today with a 14 day free trial. Click below to get started automatically plotting dated based VWAPs.
In the trading market, technical analysis is commonly used to make price action analysis easier. Anchored Volume Weighted Average Price (Anchored VWAP or AVWAP) is a technical indicator firmly entrenched in how price action is produced. Many day traders are familiar with VWAP and use it daily, but some are unaware of AVWAP and its potential value to traders.
Let’s take a look at everything you need to know when using Anchored VWAP if you’re a day trader.
VWAP vs. Anchored VWAP
The VWAP calculations are tied to a specific price bar specified by the trader using the Anchored VWAP indicator. Both VWAP and Anchored VWAP use a weighted average of price and volume to identify support and resistance areas on the chart.
VWAP is a line on a price chart that starts new at the beginning of each trading day. Traders use VWAP in various ways, such as intraday support and resistance levels, to measure trend (a VWAP moving up suggests an uptrend, whereas a VWAP moving down suggests a downtrend), to predict reversals if the price moves far away from the VWAP, and so on.
VWAP comes with disadvantages, such as not being as responsive to more recent price action. The most significant disadvantage of VWAP is that it resets at the beginning of each day. As a result, swing traders cannot use it because it is calculated using only one day’s data.
Anchored VWAP was created by Brian Shannon of AlphaTrends to solve this, which anchored the VWAP at a specific point. The only distinction is that instead of starting VWAP at the beginning of the day, AVWAP can have any starting point.
Anchored VWAP lets you define the price bar from which calculations begin, making it simple to see if the bulls or bears have been in control since a specified timeframe. The Anchored VWAP is determined by aggregating the total dollars traded in a market for all transactions and dividing the total dollars by the total shares traded, starting with the chosen benchmark.
A movement in market psychology, such as earnings, significant highs or lows, news, or other announcements, is usually marked by the initial price bar that is selected. The Anchored VWAP line is tracked using price and volume data from that major event forward.
How to Trade Using Anchored VWAP
If you’re learning how to trade using anchored VWAP for the first time, you may feel overwhelmed. But we’re here to help you understand a few Anchored VWAP day trading strategies that will benefit your trading.
To understand how to trade using Anchored VWAP, you need to know where Anchored VWAPs are typically drawn from. The following are where you can anchor the VWAP from:
significant highs and lows
periods such as the start of the week, month, or year
gaps
the point of significant news and economic events
Significant Highs and Lows
Traders should use the previous highs and lows in whatever timeframe they are looking at as their first anchor. For example, if you consider the week’s high, you can anchor by using the previous swing high or low. The average price paid by traders on the high might be calculated using an anchor from the previous low. When the price tries to fall below it, it may act as support since anyone who bought during the surge (high) does not want to lose money defending their position.
When considering a significant low, the price will move upwards after the low. The VWAP gets anchored from that low and may find support points that the price could not break through. Buyers will jump in at every break to defend the AVWAP as a support. Whether the buyers are retail traders, major organizations, computer algorithms, or other entities, we know these levels are usually well-defended and can serve as excellent support and resistance levels.
Swing VWAP automatically anchored to recent high and low
As a retail trader, you can trade based on the levels. For example:
buying when we reach a support level – we can also buy when a resistance breaks, as this may signal the start of a new trend
selling when we reach a resistance level – we can also sell when a support breaks, as this may indicate that bears have become weak
Periods such as the Start of the Week, Month, or Year
Some of the essential AVWAPs you’ll use in your trading are the week to date (WTD), month to date (MTD), and year to date (YTD). These serve as significant levels of support and resistance. Many people begin new positions on both the long and short sides as a new year, month, or week begins. The WTD, MTD, and YTD AVWAPs represent the average price they paid for their positions over the respective period, and they defend these AVWAPs whenever the price tries to cross them.
Gaps
Gap ups and downs are another great anchor. When a price gap occurs, if many buyers or sellers enter aggressively and the price keeps trending in the gapped direction, the Anchored VWAP from the gap point might be an excellent level to observe for traders.
For example, several buyers would have added to or initiated bullish positions if you’ve gapped up and the trend is strong. The average price paid for their positions is determined by starting the VWAP from the gap. You will observe a strong support level whenever the price moves below the gap up AVWAP.
Significant News and Economic Events
You want to be anchored from significant events at all times. The more significant events for futures contracts are economic releases such as:
Non-Farm Payrolls (NFP): NFPs are a key economic indicator for employment in the United States. Understanding how this data is released can assist in the setup of forex trading to profit from unanticipated changes in employment.
Unemployment Rate: The Unemployment Rate is the percentage of the entire unemployed labor force actively looking for work in the preceding month. For example, a value that is greater than predicted is considered negative or bearish for the USD, while a value that is lower than expected is considered positive or bullish.
JOLTS Job Openings: The US Bureau of Labor Statistics conducts a survey to help measure job vacancies. It gathers information from employers on their employees, job opportunities, recruitment, hires, and terminations. Job openings are all open (unfilled) positions on the last business day of the month.
Additionally, the following are also economic releases that play a significant role in futures contracts:
CPI
Consumer Sentiment
PPI
Retail Sales
FOMC Statements
FOMC Projections
Fed Fund Rate
Unemployment Claims
Industrial Production
Existing-Home Sales
Philly Fed Manufacturing Index
Crude Oil Inventories
Durable Goods Orders
PMI
Average Hourly Earnings
Pullback and Breakout Strategy
For day traders looking to get the best price before the price climbs higher, the AVWAP pullback is the most popular Anchored VWAP day trading strategy. Because day traders close their positions before the market closes for the day, day traders are limited with their trading hours and have minutes to hours to complete a trade. As a result, the closest entry at a support level can be the difference between a trade’s success and failure.
This is an excellent place to enter a trade since you know that if it closes on the opposite side of your entry point, it’s time to exit and go on to the next trade.
The VWAP breakout setup, on the other hand, is aiming for a break above the VWAP itself, preferably with strength, rather than a breakout to new highs.
For newer traders and those unfamiliar with the VWAP indicator, VWAP breakout entries are a terrific alternative and require less tape reading skills. To put it simply, you wait for the stock to test the VWAP on the downside. After that, you’ll want to see if the stock closes above the VWAP. Then, above the high of the candle that closed above the VWAP, you’ll place your buy order.
While this is a more straightforward trade entry method, it may expose you to greater risk because your entry will be further from the low and a logical stop. Your success rate, on the other hand, may mitigate the risk. To identify which entry method is best for you, you must first determine where you are in your trading journey and your risk appetite.
Practicing with Anchored VWAP
The key to making money in the markets is to practice. Risking your money on the stock market before you’ve perfected a strategy is foolish and unreasonable.
Placing AVWAP on your charts is one of the best ways to practice with it. After that, you can move the anchor around and see what happens. Some questions to ask yourself while practicing include:
Where are your support levels?
What is the point at which it breaks?
Can a chart with several AVWAPs provide more information about where long-term money is located?
It’s suggested you should use the indicator to mark significant areas of the chart, such as events, highs, lows, huge volume days, etc. The default settings are usually standard as with any indicator, but you will benefit by experimenting and getting comfortable with the Anchored VWAP.
Conclusion
In terms of determining support and resistance levels, Anchored VWAP offers all of the benefits of traditional VWAP. It also offers the advantage of allowing you to pinpoint the specific timeframe in which you should study. You can remove price action driven by another market psychology by starting VWAP calculations at the moment of a significant turning point.
AVWAP is one of the strongest technical indicators available, and if you understand how to use it, you’ll see these support and resistance levels all over the place. The Anchored VWAP, like all other technical indicators, should be used in conjunction with other indicators and analysis techniques.
We’ve just released Daily Levels 2.0, new in CodeNTrade Bundle 1.8.0.0. The Daily Levels indicator has been re-designed from the ground up to be easier to use and more performant.
What is Daily Levels?
Daily Levels automatically plots key reference levels and includes historical probabilities (for supported products) of each level being touched within the session saving traders hours of preparation work and enabling more efficient execution.
What’s new in Daily Levels 2.0?
Clean levels appear on the right side of the chart
Open levels are easier to distinguish from closed levels
Level lines across the chart are now a configurable option, off by default
Levels are attached to the background instead of the bars
Scenarios are updated immediately following session changes
DailyLevels can be added as SuperDOM indicator (Draw Path Levels must be on)
Several performance improvements for better overall platform performance
Multiple bug fixes
Daily Levels 2.0 on SuperDOM
Give it a try with our free 14 day trial! Click below to learn more.
With the release of Code-N-Trade bundle 1.7.0.0 you can add standard deviation bands on Anchored VWAPs. Standard deviation bands have been added to all Code-N-Trade Anchored VWAP products including the Anchored VWAP Drawing Tool, Indicator, and Swing VWAP. To add standard deviation bands download the latest bundle, add an Anchored VWAP to your chart, access the VWAP properties and adjust the number of standard deviation bands.
Anchored VWAP Drawing Tool Properties
Swing VWAP Indicator Properties
The 1.7.0.0 bundle also includes significant performance improvements to the Anchored VWAP Drawing Tool, reducing the amount of CPU used by over 90%.
The Daily Levels indicator for NinjaTrader 8 now includes historical probabilities for RTY and M2K. Daily Levels users can now see historical probabilities for important levels on RTY and M2K charts.
Historical probabilities indicate the percentage of sessions which hit each level in past sessions. Daily Levels supports both regular trading hours as well as the overnight session.
Interested in trying out Daily Levels? Start your free 14 day trial today!
This week we’re happy to announce the release of our new Daily Levels indicator for NinjaTrader 8. The indicator plots important levels each day and displays historical probabilities of each level being hit within the session.
To get started, download the bundle and add the Daily Levels indicator to your chart. You can start a 14 day free trial just by downloading and using the indicator. To continue using Daily Levels after your trial expires, start your subscription.
The Daily Levels indicator will automatically plot important levels for each session including prior days high/low/mid, the current and prior day’s IB high/low and more. Click the button above to see a full list of levels.
How to Use Daily Levels
The most common way to use these levels are as trade targets. If a level hasn’t been touched yet within a session, it will appear in color. If the level has already been touched in the session, it will appear gray.
Another way to use these levels is to infer if price is more or less likely to trade beyond a certain point, based on historical probabilities.
Historical Probabilities
Please keep in mind that the probabilities displayed are historical probabilities. Historical probabilities reflect the percent of sessions for which a level has been touched within past sessions. They are a reflection of the past. This may or may not accurately reflect the probability of the level being touched in future sessions.
The Daily Levels indicator plots levels on all products. Historical probabilities (percentages on each level) are initially only available for the most popular e-mini and micro CME futures products. This includes CL, GC, ES, NQ, YM, MGC, MES, MNQ, MYM. For a full list of supported products, click the button above. Historical probabilities are recomputed and updated on a regular basis. Recomputing the levels ensures that recent price action is taken into account. If you would like to see historical probabilities for other products please contact us.
The indicator supports historical probabilities for both the regular trading hours session (beginning at 9:30am ET) and the overnight session (beginning at 6pm ET). You can trade each session with probabilities computed specifically for the respective session type (regular or overnight).
The Details
The Daily Levels indicator works on time-based, tick and range charts. Since the indicator uses onBarClose, it will take 1 minute after the session open for the probabilities to be displayed for the current session. To see the labels for each level, the chart’s “Right Side Margin” property will need to be set to about 80 depending on bar width. Give it a try today, free for 14 days!
If you have any questions, suggestions or run into any issues, please don’t hesitate to contact us.
NinjaTrader® is a registered trademark of NinjaTrader Group, LLC. No NinjaTrader company has any affiliation with the owner, developer, or provider of the products or services described herein, or any interest, ownership or otherwise, in any such product or service, or endorses, recommends or approves any such product or service.
Swing VWAP automatically plotting VWAPs from 2 most recent highs and lows.
New in Code-N-Trade Bundle 1.5.0.0, the Swing VWAP Indicator takes the work out of managing anchored VWAPs from recent swing highs and lows. Just add the indicator to your chart, set the strength and number of swing high/low VWAPs to plot and let it automatically plot and update VWAPs anchored to recent swing highs and lows.
As new swing highs and lows unfold, the indicator will automatically add these new highs and lows. By tuning the strength setting, you can configure whether you want the indicator to snap to minor highs and lows or if it should prefer more major highs and lows.
By default, the indicator will plot Anchored VWAPs from the most recent swing highs and lows only. To plot additional highs/lows, adjust the “How Many” setting. If you want to plot VWAPs from the three most recent highs and lows (6 VWAPs total) set “How Many” to 3.
The indicator supports both time-based charts as well as tick charts.
Gone are the days of adding anchored VWAPs to swing highs and lows only to remove them later and re-add them to new highs and lows. Let Swing VWAP do the work for you.
As with all of our tools, you can get started today with a 14 day free trial. Click below to get started.
Click on “Anchored VWAP” from the “Drawing tools” menu
Click on a bar on your chart to start the Anchored VWAP from
Anchored VWAP Indicator
Using the anchored VWAP indicator is very similar to the drawing tool. The only difference is, instead of clicking on a bar to select the start point, you manually type the date and time into the indicator properties.
Why would you go through this extra effort? Because orders can be attached to indicators.